


Continuation Research Projects
Projects links
- Evaluation of commercially available sunflower cultivars
- Oilseeds South African Soybean Crop Quality Survey
- The funding of the Supply and Demand Estimates Committee
- Oilseeds South African sunflower crop quality survey
- The role of seedling diseases in poor establishment of sunflower in South Africa
- National soybean cultivar trials
- Sclerotinia sclerotiorum disease potential and management responses in soybean and sunflower
- South African Sclerotinia Research Network: Community of practice
- Phenotypic and genotypic screening of soybean to identify potential sources of resistance to the destructive pathogen, Sclerotinia sclerotiorum
- Investigation of the aggressive, seedborne nematode species Robustodorus arachidis n. comb. on groundnut
- Sudden death syndrome of soybean in South Africa: etiology etection and management
- Website
- Oilseeds information
- Cultivar evaluation of oil and protein seeds in the winter rainfall area: Western and Southern Cape (canola)
-
Evaluation of commercially available sunflower cultivars
Cultivar trials from previous years showed that the mean yield of the five best cultivars is usually about 0.18 t ha-1 higher than the overall mean yield of all the tested cultivars. Considering that the national mean yield that farmers obtain is normally between 1.0 and 1.4 t ha-1, it is clear that cultivar selection has a significant effect on the profitability of sunflower production. This project is the only independent source of information on sunflower cultivar performance, available to producers. The aim of this project is to evaluate commercially available sunflower cultivars at different localities in collaboration with seed companies. During the 2019/20 season, 26 cultivars were evaluated in 21 successful locality trials. The highest trial mean yield of 3.52 t ha-1 was obtained at Kroonstad planted on the 17 January 2020 and the lowest of 0.89 t ha-1, at Potchefstroom with late planting date of 5 February. The six best performing cultivars, in terms of average yield calculated over localities, were PAN 7156 CLP, P 64 LL23, PAN 7080, AGSUN 5270, PAN 7160 CLP & PAN 7100. The overall mean yield for 2019/20 was 2.50 t ha-1, 12 % higher than the mean yield of 2018/19. Eleven Clearfield and Clearfield plus cultivars were entered and one of these cultivars PAN 7156 CLP had the highest yields of 2.78 t ha-1 and performed the best in terms of seed yield. Eight of these cultivars namely, PAN 7156 CLP, PAN 7160 CLP, AGSUN 5103 CLP, AGSUN 5106 CLP, AGSUN 5102 CLP, PAN 7102 CLP, P 65 LP 54 and AGSUN 5101 CLP have yields higher than the overall mean yield of all cultivars. Seventeen cultivars were evaluated at 47 localities for the last three seasons and the cultivars, PAN 7156 CLP, PAN 7080, AGSUN 5270, PAN 7160 CLP and AGSUN 8251 had the highest yields. Probability to obtain an above average yield was calculated for all cultivars across the usual range of yield potentials. That was done for the 26 cultivars during the 2019/20 growing season, for the 22 cultivars that have been tested at 35 localities for the last two-seasons and for the 17 cultivars that have been tested at 47 localities for the last three seasons. The yield probability method is highly recommended for cultivar selection.
-
Oilseeds South African Soybean Crop Quality Survey
During the harvesting of the 2019/2020 production season, which was the nineth annual soybean crop quality survey conducted by the SAGL, a representative sample of each delivery of soybeans at the various silos was taken according to the prescribed grading regulations. One hundred and fifty composite soybean samples, proportionally representing the different production regions, were analysed for different quality parameters. The samples were graded, milled and chemically analysed for moisture, protein, fat and ash content. Fifteen randomly selected samples were analysed to quantitatively determine the presence of genetically modified soybeans. Precision Oil Laboratories was subcontracted to perform fatty profile analyses on 20 composite crop samples representing the different production regions as well as 21 cultivar samples from different localities. These analyses were included to address the need for a national updated database for fatty acid composition of soybean oil.
The goal of this crop quality survey is to accumulate quality data on the commercial soybean crop on a national level. This valuable data reveal general tendencies, highlight quality differences in commercial soybeans produced in different local production regions and provide important information on the quality of commercial soybeans intended for export. With this data, SAGL is building up a database with quality data over different production seasons which can be used for decision making processes. The results are available on the SAGL website. The hard copy reports are distributed to all the Directly Affected Groups and interested parties. The report is also available on the website. The 2019/20 Report of the National Soybean Cultivar trials conducted by the ARC-Grain Crops Institute is also included in the report, as is the national grading regulations as published in the Government Gazette of 21 April 2017.
Summary of results
Seventy-three percent (109) of the 150 samples analysed for the purpose of this survey were graded as Grade SB1, while 41 (27%) of the samples were downgraded to COSB (Class Other Soya Beans). During the previous two seasons, 11% (2018/19) and 13% (2017/18) of the samples were downgraded to COSB.
- Four of the 41 samples were downgraded as a result of the percentage other grain exceeding the maximum permissible deviation of 0.5%.
- Eight of the samples were downgraded as a result of the percentage defective soybeans on the 4.75 mm round-hole sieve exceeding the maximum permissible deviation of 10%.
- Fifteen samples were downgraded as a result of the percentage soiled soybeans present in the samples exceeding the maximum permissible deviation of 10%.
- Six samples were downgraded as a result of the number of Datura sp. poisonous seeds present exceeding the maximum permissible number of 1 per 1000 g.
- The remaining eight samples were downgraded as a result of a combination of one or more of the following deviations exceeding the maximum permissible deviation: foreign matter, other grain, sunflower seed, stones, defective soybeans above the 4.75 mm sieve, soiled soybeans and poisonous seeds (Datura and Ipomoea purpurea Roth.).
Wet pods were not present in any of the 150 samples received and graded.
The percentage samples containing sclerotia from the fungus Sclerotinia sclerotiorum, increased from 27% (41 samples) in the previous season to 41% (62 samples) this season. In the 2017/18 season, 88 samples (59%) contained sclerotia. The three highest percentages sclerotia, 1.10%, 0.60% and 0.30% were all observed on samples originating in Mpumalanga. As a matter of fact, 52% of the samples that contained sclerotia originated in Mpumalanga. All these percentages sclerotia found to be present in the samples are however still well below the maximum permissible level of 4%. The national weighted average percentage this season was 0.06% compared to the 0.03% of the previous season.
The samples received from Mpumalanga province (65 samples) had the highest percentage foreign matter (0.91%), followed closely by the 0.88% weighted average of the 51 samples from the Free State regions. The percentage foreign matter in the rest of the samples ranged from 0.10% in the sample from Limpopo to 0.79% in Gauteng (8 samples). The national weighted average of 0.83% was in line with previous seasons.
All fifteen samples tested for genetic modification (GM), tested positive for the presence of the CP4 EPSPS trait (Roundup Ready®).
The nutritional component analyses, namely crude protein, - fat, - fibre and ash are reported on a dry/moisture-free basis (db) for the current as well as the previous surveys. For comparison purposes the national average 'as is' or wet basis results for the last five seasons are provided in the Table 1 below. These 'as is' average values were calculated by converting each individual value from dry basis to "as is".
Comparison of weighted average nutritional component values on a dry and 'as is' basis over four seasons SEASON 2019/2020 2018/2019 2017/2018 2016/2017 2015/2016 Moisture, % (17hr, 103ºC) 7.2 7.0 7.4 7.4 7.4 MOISTURE BASIS DRY AS IS DRY AS IS DRY AS IS DRY AS IS DRY AS IS Crude protein, % 39.99 37.12 40.43 37.60 40.18 37.40 40.15 37.20 40.22 37.22 Crude fat, % 18.0 16.7 19.1 17.8 19.3 18.0 19.8 18.5 19.4 17.9 Crude fibre, % 7.0 6.5 6.8 6.3 5.9 5.5 5.9 5.4 7.3 6.8 Ash, % 4.63 4.19 4.67 4.34 4.59 4.27 4.58 4.24 4.61 4.27 NUMBER OF SAMPLES 150 150 150 150 150 The graphs below provide
comparisons between provinces
for the nutritional components tested
Average crude protein content over five seasons (2015/2016-2019/2020) 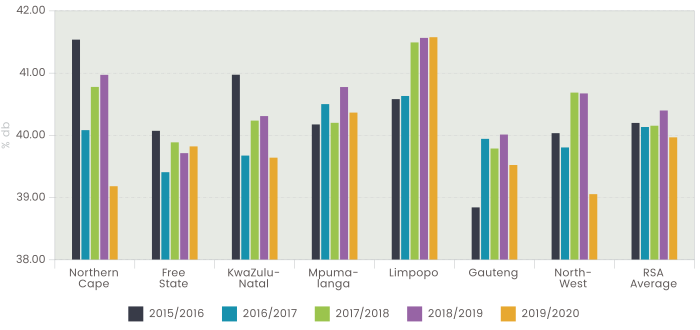
Average crude fat content over five seasons (2015/2016-2019/2020) 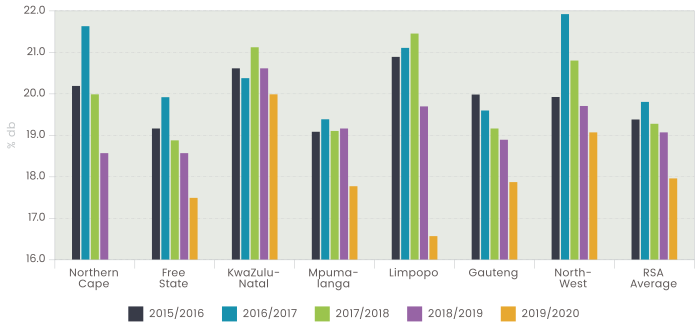
Average crude fibre content over five seasons (2015/2016-2019/2020) 
Average ash content over five seasons (2015/2016-2019/2020) 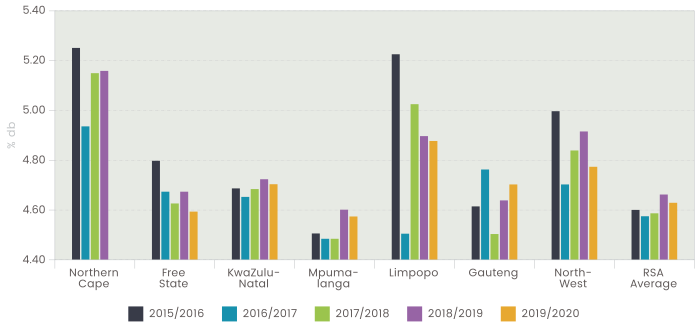
The 2019/20 season is the second season that the SAGL conducted the moisture, crude protein and crude fat analyses on the ARC Grain Crops soybean cultivar trials' samples. Please see a comparison of the results between the crop survey and cultivar samples in Table 2.
Comparison between the moisture, crude protein and crude fat results of the soybean cropQUALITY AND ARC CULTIVAR SAMPLES OF THE 2019/2020 SEASON Analysis Moisture, % Crude Protein, % Crude Protein, % Crude Fat, % Crude Fat, % (17hr, 103ºC) (db) (as is) (db) (as is) SOYBEAN CROP QUALITY SURVEY RESULTS Average 7.3 39.99 37.12 18.0 16.7 Minimum 6.4 33.81 31.54 15.4 16.7 Maximum 10.0 43.70 40.68 22.1 20.4 Standard Deviation 0.64 1.42 1.32 1.20 1.11 No of samples 150 150 150 150 150 ARC GRAINS CROPS CULTIVAR SAMPLE RESULTS Average 7.8 40.87 37.68 19.9 18.4 Minimum 6.9 38.47 35.33 15.8 14.6 Maximum 8.8 44.87 41.33 23.5 21.7 Standard deviation 0.51 1.25 1.15 1.96 1.84 No of samples 84 84 84 84 84 % Difference crop vs cultivar samples -0.6 -0.9 -0.6 -1.8 -1.7 -
The funding of the Supply and Demand Estimates Committee
Introduction
It is important to note that the purpose of the monthly Supply and Demand Estimates Committee (S&DEC) meetings is to capture new information that is available in the market at a specific time. It is also crucial to understand that access to accurate market information plays a central role in any agricultural development and, to some extent, information can address other issues such as food security. In 2011, Grain South Africa applied for a statutory measure for grain traders to report information on export and import contracts. A similar approach is practised in the United States of America. The Grain SA application was opposed by other directly affected groups such as the South African Cereals and Oilseeds Trade Association (SACOTA); however, collaboration within SACOTA and the Supply and Demand Estimates Committee was subsequently established. The proposed statutory measure was then put on hold, and the committee sought to perform its activities without the interference of the statutory measure. The industry thus appointed Dr John Purchase as Chairperson of this committee, with the National Agricultural Marketing Council (NAMC) acting as secretariat. Following all industry engagements and consultations, the first official Supply and Demand Estimates report was published at the end of June 2013. The establishment of this committee was demand driven by the need to produce accurate and transparent market information to ensure that the market functions more efficiently for the participants.
Purpose of the South African Supply and Demand Estimates (SASDE) Report
The report provides an anlaysis of the fundamental conditions of the major grains and oilseeds in South Africa. The report is normally released within four to five working days after the Crop Estimates Committee (CEC) meeting. The report is released into the public domain by the approval of the South African competition authorities.
Composition of the S&DEC
The S&DEC is a technical committee that communicates directly with industry role players through the Supply and Demand Estimates Liaison Committee (S&DELC). The S&DEC consists of a chairperson with two independent specialists appointed by the industry; the NAMC acts as the secretariat with four staff members, the South African Grain Information Service (SAGIS) and the secretariat of the CEC from the Department of Agriculture, Forestry and Fisheries (DAFF).
NAMC representatives
- Dr Christo Joubert – Manager: Agro Food Chains
- Ms Rika Verwey – Senior Economist
- Ms Lizette Mellet – Senior Economist: Statutory Measures
- Dr Abongile Balarane – Grain Specialist
DAFF representatives
- Ms Rona Beukes – Senior Statistician: Crop Estimates
- Ms Marda Scheepers – Senior Statistician: Crop Estimates
SAGIS representative
- Mr Nico Hawkins – CEO: SAGIS
Independent specialists
- Dr Andre Jooste
- Mr Peter Watt
- Dr Anton Lubbe
Methodology used by the S&DEC
Process before the meeting
- The S&DEC meeting takes place three to five working days after the CEC meeting, at the end of each month with the exclusion of December.
- A reminder is sent to all co-workers approximately seven days before the S&DEC meeting, requesting that they submit estimates on imports, exports and consumption for selected grains and oilseeds.
- The S&DEC meeting takes place in a lockdown room with no cell phones allowed, except when there is uncertainty about any of the figures sent by co-workers.
Factors that are taken into account during the meeting
- Supply figures
- CEC published figures
- S&D historical figures
- Demand figures
Report
The NAMC retrieves the number of website hits every month. The purpose of this exercise is to track the number of end-users of the SASDE report. It is noted from the NAMC monthly website hits that about 1000 hits are received for the SASDE report. The report is mainly utilised by the following:
- Academia
- Financial and investment institutions
- Government officials
- Grain Millers
- Oilseed processors
- Feed manufactures
- Grain and oilseed traders
- Grain and oilseed storage handlers
- Baking industry
- Research institutions and transport organisations
- Others
Conclusion
The efficacy of information plays a significant role in developing nations. Relevant and accurate information can ensure the sustainability of the market and also that a nation's food security is well-considered following private and government objectives. It is initiatives such as the SASDE report that could provide effective information to the market for a specific period. The publication of the SASDE report has taken the grain and oilseeds market in South Africa and the region to another level, as evident from the statistics on the end-users of the report. The mutual understanding and collaboration of the NAMC and the trusts have also contributed significantly to the functioning of the S&DEC.
Such support is what the committee requires in ensuring that its functions are fulfilled and continuously improved.
-
Oilseeds South African sunflower crop quality survey
This was the eighth annual national sunflower crop quality survey performed by The Southern African Grain Laboratory NPC.
During the harvesting season, a representative sample of each delivery of sunflower seeds at the various silos was taken according to the prescribed grading regulations. The sampling procedure as well as a copy of the grading regulations form part of the report. One hundred and seventy-six composite sunflower samples, representing the different production regions, were analysed for quality. The samples were graded, milled, and chemically analysed for moisture, crude protein, crude fat, crude fibre as well as ash content. Precision Oil Laboratories was subcontracted for the second consecutive season to perform fatty profile analyses on 20 composite crop samples representing the different production regions as well as 20 cultivar samples from different localities. These analyses were included to address the need for a national updated database for fatty acid composition of sunflower oil.
The goal of this crop quality survey is the compilation of a detailed database, accumulating quality data collected over several seasons on the commercial national sunflower crop, which is essential in assisting with decision making processes. The results are available on th SAGL website. The hard copy reports are distributed to Directly Affected Groups and interested parties. The report is also available on the website.
In addition to the quality information, production figures obtained from the Crop Estimates Committee (CEC) relating to hectares planted, tons produced, and yields obtained on a national as well as provincial basis, over an eleven-season period, are provided in this report. SAGIS (South African Grain Information Service) supply and demand information, including import and export figures over several seasons are provided in table and graph format.
The report of the Evaluation of sunflower cultivars 2019/20 season conducted by the ARC-Grain Crops Institute in collaboration with Agricol, Pannar, Pioneer, Syngenta, Sensako and Link Seed is also included in this report, as is the national grading regulations as published in the Government Gazette No. 45 of 22 January 2016.
Summary of results
Sixty-three percent (111) of the 176 samples analysed for the purpose of this survey were graded as Grade FH1, with 65 of the samples downgraded to COSF (Class Other Sunflower Seed). This is the highest percentage (37%) of samples downgraded to Class Other Sunflower Seed (COSF) since commencement of the sunflower crop surveys in 2012/13.
- Nineteen (29%) of the samples were downgraded as a result of the percentage of either the screenings or the collective deviations or a combination of both exceeding the maximum permissible deviations of 4% and 6% respectively.
- Five samples (8%) were downgraded due to the percentage damaged sunflower seeds exceeding the maximum permissible deviation of 10% as well as presence of sour odour.
- Fifteen samples in total (23%) were downgraded as a result of the presence of poisonous seeds. Thirteen samples were downgraded due to the presence of Datura sp. and one due to Crotalaria sp. exceeding the permissible number of 1 per 1000g. Another sample was downgraded due to Xanthium strumarium (cocklebur) seeds exceeding 7 per 1000g.
- The remaining 40% (26) samples were downgraded as a result of a combination of one or more of the following deviations exceeding the maximum permissible deviation: damaged sunflower seeds, screenings, foreign matter, sclerotia, percentage collective deviations as well as the presence of poisonous seeds (Datura spp.) or an musty odour.
A sample from Gauteng province reported the highest weighted average percentage screenings namely 4.79%, followed by the Free State (N = 84) and Limpopo (N = 13) provinces with 2.56% and 2.55%. North West Province (72 samples) averaged 2.29% and Mpumalanga's six samples the lowest percentage screenings of 1.29%. The weighted national average was 2.42% compared to the 2.21% of the previous season.
The highest weighted average percentage foreign matter (1.83%) was reported for the Free State provinces' regions. Gauteng and North West followed with 1.65%. and 1.44% respectively. The South African average was 1.55% compared to the 1.28% and 1.16% of the previous two seasons. This season's average was also the highest reported since commencement of these crop surveys in the 2012/13 season.
The number of samples received for this survey that contained sclerotia from the fungus Sclerotinia sclerotiorum, increased from 90 samples (51%) in the previous season, to 125 samples (71%) this season. 54% of these samples originated in the Free State province, and 45% from North West. Single samples from Mpumalanga and Gauteng also reported sclerotia. Two samples (both from the Free State) exceeded the maximum permissible deviation of 4%. Weighted average levels ranged from 0% in Limpopo to 0.57% in North West and 0.66% in the Free State. The national average of 0.55%, is the second highest since the 0.53% of the 2013/14 season. Last season's average was 0.43%.
The nutritional component analyses, namely crude protein, fat, fibre and ash are reported as % (g/100 g) on an 'as received' or 'as is' basis. The graphs provide comparisons between provinces for the nutritional components tested.
Average crude protein content, % 'as is' 
Average crude fat content, % 'as is' 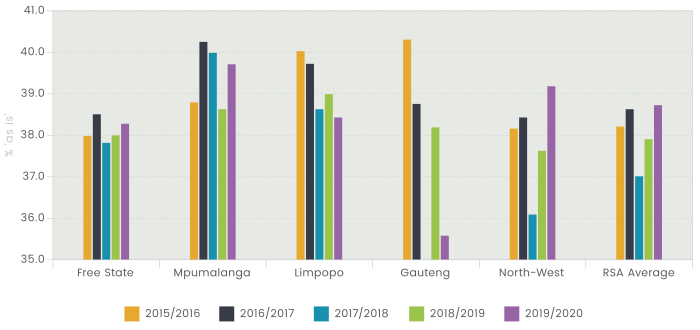
Average crude ash content, % 'as is' 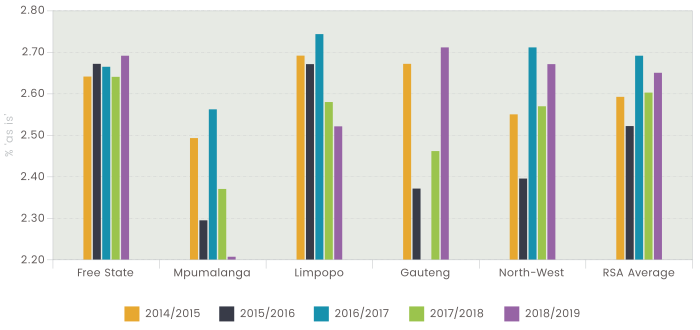
Average crude fibre content, % 'as is' 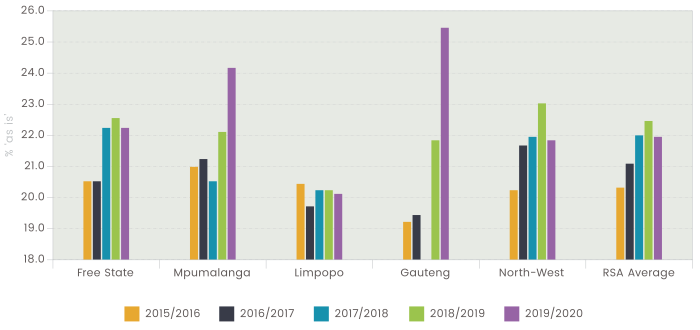
The SAGL conducted the moisture, crude protein and crude fat analyses on the ARC Grain Crops sunflower cultivar trials' samples. Please see a comparison of the results between the crop survey and cultivar samples in the table below:
Comparison between the moisture, crude protein and crude fat results of the sunflower crop quality and arc cultivar trial samples of the 2019/20 season Analysis Moisture Crude Protein Crude Fat % (17 hr, 103ºC) % (as is) % (as is) SUNFLOWER CROP QUALITY SURVEY RESULTS Average 4.8 15.66 38.7 Minimum 2.9 11.54 30.2 Maximum 7.5 19.84 47.0 Stdev 0.73 1.40 2.54 N 176 176 176 ARC GRAINS CROPS CULTIVAR SAMPLE RESULTS Average 5.3 15.84 40.4 Minimum 3.2 11.44 25.6 Maximum 7.6 22.95 53.8 Stdev 0.88 2.42 7.22 N 104 104 104 % Difference between crop and cultivar samples -0.5 -0.18 -1.7 -
The role of seedling diseases in poor establishment of sunflower in South Africa
Poor establishment has been identified as one of the important constraints in sunflower production in South Africa. Although the contribution of other factors such as seedling vigour, seedbed preparation and soil temperature to poor establishment have been investigated, there is no information on the role of seedling diseases as a production constraint in sunflower production in South Africa. The main aim of this study was to determine the incidence of seedling diseases of sunflower and the major causal organisms associated with these diseases, as well as the efficacy of the standard seed treatment to control the most important pathogens.
The most important pathogens involved in poor establishment of sunflower seedlings were identified and it was shown that the standard seed treatment is not effective against many of the virulent pathogens. Other biological and chemical compounds were evaluated against single pathogens as well as combinations of pathogens. The most effective chemical treatment [ST6 = from Syngenta with a.i. thiabendazole, azoxystrobin, fludioxonil and mefenoxam + Cruiser® 600 FS from Syngenta with a.i thiamethoxam (insecticide)] was selected to be compared with three saprophytic fungi or non-pathogenic fungi (F. incarnatum-equiseti species complex, P. acanthicum and Rhizoctonia AG-A that were frequently isolated from sunflower seedlings during the surveys) against different combinations of the most virulent pathogens. Seven combinations/mixes of the different pathogens were included as follows: Control (no pathogen), mix 1 [Fusarium solani species complex (FSSC)], mix 2 (both Pythium spp.), mix 3 (all four R. solani AGs), mix 4 (FSSC and both Pythium spp.), mix 5 (FSSC and all four R. solani AGs), mix 6 (both Pythium spp. and all four R. solani AGs) and mix 7 (FSSC, both Pythium spp. and all four R. solani AGs). Seed treatment ST1 was untreated seed Pathogen mixes 3, 5, 6 and 7 caused significant reductions in survival of sunflower seedlings. There was no (pathogen mixes 3 and 7) or very little (0.8%) survival for the treatments with the saprophytic fungi whereas survival rates of 59.2, 58.3, 50.8 and 50.8% were recorded for these mixes, respectively for treatment ST6. Application of saprophytic Fusarium, Rhizoctonia and ST6 treatments in soil not inoculated with pathogens caused a significant reduction in growth. Compared to the controls inoculated with the pathogen mixes only ST6 significantly improved growth in pathogen mix 1, saprophytic Fusarium and ST6 in pathogen mix 2 and saprophytic Rhizoctonia and ST6 for pathogen mix 4. None of the saprophytic fungi significantly reduced root rot severity whereas ST6 significantly reduced root rot severity in pathogen mixes 1 and 2. Hypocotyl rot severity was highest in pathogen mix 1 and all the saprophytic fungi and ST6 significantly reduced hypocotyl rot severity in this pathogen mix. The saprophytic fungi were not able to improve survival or reduce root rot which are the two most important parameters measured in this study and it seems that they are not able to compete with the most virulent fungi included in this study. Proper establishment of seedlings is very important to improve yield and an essential component of sustainable production. Our results showed that seed treatment ST6 is the most effective treatment to significantly improve establishment of sunflower seedlings. Previously, other treatments that were also effective were treatments ST2 and ST3 [ST2 = Experimental Code BYF14182 from Bayer Crop Science with a.i. not disclosed + Cruiser® 600 FS from Syngenta with a.i thiamethoxam (insecticide) ; ST3 = Experimental Code BYF14182 from Bayer Crop Science with a.i. not disclosed + Cruiser® 600 FS from Syngenta with a.i thiamethoxam (higher dosage than ST2)] and these treatments were often more effective than the standard registered seed treatment [ST5 = Celest® XL from Syngenta with a.i. fludioxonil and mefenoxam + Cruiser® 600 FS from Syngenta with a.i thiamethoxam (insecticide)]. The ability of seed treatments ST2, ST3 and ST6 to protect seedlings against a complex of the most important pathogens affecting sunflower seedlings is very significant. Many of the pathogens affecting sunflower seedlings have a broad host range and cannot be controlled with crop rotation. Since crop rotation is such an important part of conservation agriculture, crops such as maize, sunflower and soybean that are susceptible to some of the same pathogens, are often rotated in the same field. In order to protect seedlings against these pathogens with a broad host range, effective seed treatment can play a significant role and should be included in an integrated management strategy against soilborne diseases of sunflower. The current study demonstrated the ability of seed treatments which included combinations of active ingredients to effectively target a complex of pathogens associated with sunflower seedlings to significantly improve survival, growth and reduce root and hypocotyl rot severity. The results obtained under glasshouse conditions showed that it would be worthwhile to evaluate these treatments under field conditions in different production areas with different disease complexes and climatic conditions in order to confirm the positive results obtained in the glasshouse study, and also to motivate for registration of products that effectively controlled the most virulent pathogens of sunflower seedlings.
-
National soybean cultivar trials
A total of 28 commercially certified cultivars were evaluated for the cool, moderate and warm areas, for the 2019/20 season in 21 field trials. Only GMO cultivars were included in the trials and Roundup applications were used during the execution of the trials. A randomised latinised row/colum design with three replicates was used for all field trials. Date of flowering (50% flowering), date of harvest maturity, length of growing season, plant height, pod height, green stem, lodging, shattering, 100 seeds mass, undesirable seed and the yield probability of cultivars calculated. Yield probabilities served as guideline for cultivar selection.
The mean number of days from planting to 50% flowering of cultivars for the cool, moderate and warm areas were 71, 58 and 50 days respectively. The overall mean yield was 3429 kg ha-1 for the cooler areas, 3137 kg ha-1 for the moderate and 2818 kg ha-1 for the warm areas. Cultivars with a high yield probability are important in the selection of cultivars by producers due to the reliability of the expected future yield. DM 5351 RSF and PAN1521 R for the cooler areas; NA5509 r, LS6860 R, DM6.8i RR for the moderate and P61T38R for the warmer areas can be regarded as all-rounders' with a yield propability >50% for all the yield potentials.
-
Sclerotinia sclerotiorum disease potential and management responses in soybean and sunflower
Sclerotinia diseases causes substantial yield losses in South Africa and is extremely hard to manage. Sclerotinia disease management is limited by the extensive host range and duration of survival of sclerotia in soil, the lack of registered active ingredients for chemical control as well as limited tolerant germplasm available for conventional resistance breeding.
Fundamental knowledge of disease management has been lacking and key to this regard is understanding how to identify tolerant/susceptible genotypes. The complexity of the pathogen and how it interacts with the host and environment is fundamental to the poor correlation observed between greenhouse and field screening of cultivars. The study aims to build fundamental knowledge to determine the tolerance or susceptibility of local soybean and sunflower cultivars to Sclerotinia sclerotiorum while also exploring the scientific basis of alternative management practices available to producers. The objectives of the study were to:
- develop a robust artificial inoculation technique for field trials (which has been completed),
- develop a methodology for evaluating cultivar responses to Sclerotinia infection during field trials (completed) and
- evaluate the tolerance/susceptibility of soybean and sunflower cultivars to S. sclerotiorum in field trials (in progress). Additional aims were to test alternative management options and pilot the use of the Sporecaster app in South Africa.
Soybean and sunflower cultivar trials were planted in Delmas (under artificial inoculation) and in Clocolan (under natural inoculation) during the 2018/19-2020/21 seasons. Field trials in Delmas consisted of 36 soybean and 26 soybean cultivars planted across four planting dates. During the 2019/20 season, bird damage occurred and travel restrictions due to the national lockdown prohibited data collection at some critical time points. Despite this, data was still collected and analyses completed. Trials planted during the 2020/21 season were successfully completed and evaluated. Data analyses are being finalized.
The viability of sclerotia after being passed through bovine digestive systems as well as after exposure of heat was investigated. A total of 108 sclerotia were harvested from cattle manure in Clocolan and grouped into five weight classes, surface sterilized and plated onto general PDA media plates. Counts were made based on the ability of sclerotia germination after passage through cattle digestive system. Only 4% of the harvested sclerotia germinated and were in the 0.030g and 0.300g weight classes. Preliminary data from this study therefore showed that cattle grazing has limited potential to spread disease from field to field.
The effect of heat on sclerotia viability was investigated by exposing sclerotia to a range of temperatures and durations (125˚C to 200˚C for 5 min, 10 min and 15 min, either buried at a 5 cm depth into soil or left on the soil surface). Sclerotia were surface sterilized, plated onto general PDA media and counts were made based on the ability of sclerotia to germinate. Analysis indicated significant differences between temperature, time and depth as well as an interaction between temperature x time and temperature x depth. The longer sclerotia were exposed to higher temperatures, the less the ability to germinate. This study therefore provided preliminary data showing that exposing fields to excessive heat could reduce disease pressure in the subsequent season.
This study is also piloting the use of the Sporecaster App, which forecasts the risk of apothecia being present in soybean fields. The app uses site specific information (location and agronomic decisions provided by the user) and assimilated weather data to predict the best timing for treatment in that particular field. This early detection model is being used by the University of Wisconsin-Madison Integrated Pest and Crop Management team in the USA. The feasibility of applying this app in South Africa is being tested and the app has no cost implications for the user. Piloting the use of the Sporecaster app is still in progress as producer participation has been challenging, as testing relies primarily on in-field piloting by producers to collect sufficient data.
This project built fundamental knowledge in disease management. Inoculation and field screening methods were optimised to deliver successful cultivar evaluations, with three successful seasons concluded for sunflower cultivar evaluations, and two successful seasons for soybeans. A further highlight from this project is that it has provided an important scientific basis of certain alternative management options for producers.
-
South African Sclerotinia Research Network: Community of practice
Sclerotinia diseases are extremely difficult to manage due to longevity of sclerotia in soil in and lack of control options (such as resistant varieties and limited chemical and biological control). Producer-focused research is pivotal for finding on-farm solutions and requires a coordinated approach to establish collaborations not only between researchers, but also between the research community and industry. Therefore, a virtual community of practice (CoP) was established to serve as a platform for researchers to create collaborations, to allow for parallel and comprehensive research and to act as catalyst for the development of applied intervention technologies for producers. Furthermore, generating social and academic capital, where experienced investigators exchange knowledge with junior investigators, thus developing skills related to Sclerotinia diseases and ensuring technology and intellectual transfers, can contribute significantly to continuation.
The three key issues on which the SASRN focuses on are:
- generating a virtual centre of excellence and expertise (through the use of a website and communication platform);
- the role South Africa can play in the Sclerotinia research arena internationally, and most important
- developing and communicating practical management strategies for diseases caused by Sclerotinia for our local producers.
During 2020, a literature review was conducted on past Sclerotinia research projects to identify knowledge gaps, which will be published in the coming months.
The website is continually updated with short information pieces. The newest feature to the network is the live videos of the field work being conducted in Delmas and Clocolan. Producers have responded well to this watching the live videos, actively participating in the hotline and other social media pages. The communication with the public via the social media platforms provides the opportunity to learn about producer and industry needs. Furthermore, popular articles through multiple platforms (such as magazines and the website) contribute to information transfer. Two articles of interest are "Evaluating soya bean cultivar tolerance to Sclerotinia stem rot under field conditions" and "Evaluating sunflower for yield, quality, characteristics, and Sclerotinia tolerance" (Oilseeds Focus December 2020 and March 2021, respectively).
The University of the Free State attended an annual (now virtual) farmers day in Delmas for the Network and their research in the first week of March (AIS Insette dag 2021 – Sclerotinia Research Network). Information on the pathogen, the SASRN as well as the research conducted at the University of the Free State were shared. Efforts to increase collaborative research projects are underway.
-
Phenotypic and genotypic screening of soybean to identify potential sources of resistance to the destructive pathogen, Sclerotinia sclerotiorum
Soybean is highly susceptible to Sclerotinia sclerotiorum and the impact of infection on this crop is high. Agronomic practices have been suggested to reduce the damage caused by Sclerotinia diseases, however, in favourable environments these practices are often insufficient. Therefore, resistant varieties remain one of the best strategies for Sclerotinia disease management. In South Africa, no known acceptable sources of resistance to Sclerotinia diseases are available and knowledge of sources of resistance is limited because of screening constraints. However, resistance sources from different countries/regions are available for soybeans to be used in breeding programmes. Therefore, the aim of this study is to screen South African commercial soybean cultivars for Sclerotinia resistance by using both phenotypic and genotypic screening methods.
South African commercial soybean cultivars will be screened to determine the genotypic compilation of these cultivars with regards to Sclerotinia resistance genes. In addition, germplasm preliminarily identified as toletant from a previous project as well as resistant cultivars attained from Argentina will be subjected to three repetitions of greenhouse and field trials to confirm the genotypic data generated. Moreover, a culture collection of South African S. sclerotiorum isolates will be established and maintained.
Soybean germplasm from an Argentinian breeding programme as well as local sources were screened using 54 molecular markers to identify potential sources of resistance. Genotypic data revealed germplasm which have the genetic potential to serve as resistance sources, and cultivars with the best combination of targeted Sclerotinia resistance QTL were selected for screening in greenhouse and field conditions. Three repetitions of the greenhouse trials were completed and results correlated well with genotypic data. In addition, a detached leaf assay was done during February and March of 2021 to confirm the phenotypic validation from the greenhouse trials. This experiment was completed successfully and also confirmed the results obtain from marker data and the phenotypic validation. Field trials are still in process. The field trials planted in tunnels in November 2020 were unsuccessful due to low germination rate. The trial was repeated during January and February of 2021. Evaluation was done 14 days after inoculation. Unfortunately, the current data does not correlate well with the data generated from the greenhouse trials. However, a further two repetitions of the field trials will be conducted to confirm results. Despite this, five local cultivars showing promise of potential resistance were identified.
The S. sclerotiorum culture collection is progressing well and contains isolates collected from six different crops across eight of South Africa's provinces. New isolates from various crops are incorporated into the culture collection on a regular basis. Isolates from the culture collection were distributed to other researchers within the SASRN to contribute to Sclerotinia-related research. The culture collection is updated regularly and a digital recordkeeping is in place to capture information on location collected, morphology and pathogenicity.
The identification of SA cultivars with resistance potential can help with the improvement of soybean production as well as disease management and control. To date, South African soybean cultivars have preliminarily been identified which show acceptable levels of tolerance, however, these results need to be confirmed in field trials.
-
Investigation of the aggressive, seedborne nematode species Robustodorus arachidis n. comb. on groundnut
Robustodorus arachidis (new combination) was originally identified as Aphelenchoides arachidis (testa nematode) on severely damage groundnut from the Vaalharts Irrigation Scheme, Northern Cape Province. It appeared as if this nematode was seed-borne, similar to Ditylenchus africanus (pod nematode). However, based on field observations, R. arachidis appeared to be more aggressive than D. africanus. Since R. arachidis was previously unknown and only identified in South Africa for the first time, there is no information available on this nematode. A lack of information on R. arachidis will hamper the implementation of effective and sustainable management strategies and enable this pest to spread unhindered. Therefore, the objectives of this part of the study were:
- to determine whether nematicides currently registered for control of plant-parasitic nematodes are effective in keeping this nematode under control,
- to study the occurrence of R. arachidis on groundnut and compare it to D. africanus, and
- to determine whether crops planted in rotation with groundnut serve as host for R. arachidis.
To achieve these objectives, trials were planted by hand on the field in which this nematode was first discovered. The groundnut cultivar Sellie Plus was used in all of the trials. The trial involved in the evaluation of currently registered nematicides for the control of R. arachidis on groundnut consisted of a randomized complete block design with five treatments (including an untreated control) and six replicates. Nematode data was ln(x+1) transformed to lessen the natural variation within replicates and subjected to ANOVA. Means were separated, using the P < 0.05 Tukey test. The second trial in which the occurrence of R. arachidis was studied and compared to that of D. africanus, was planted in the same field. Nematode evaluations for both trials were done at harvesting. To achieve the third objective, groundnut, wheat and maize samples were collected throughout the year on the naturally infested site. All plant-parasitic nematodes were identified in soil, root and pod (in the case of groundnut) samples. R. arachidis occurred in soil, root and pod (hull and kernel) samples. None of the nematicides were able to keep the R. arachidis numbers significantly lower than that in the untreated control and was, therefore, not effective in the control of this nematode on groundnut during the 2019/2020 summer growing season. Compared to D. africanus, R. arachidis dominated in the pods although D. africanus numbers were higher in the root samples. It seemed as if these two nematode species competed for the same niche in the groundnut plant and that R. arachidis were more aggressive than D. africanus. Similar to the distribution of D. africanus within the groundnut plant, the highest portion of the R. arachidis population occurred within the pod. These trials confirmed, furthermore, that R. arachidis is seed-borne and are consequently likely to spread throughout the groundnut production area by planting of infested seed. In terms of host range, R. arachidis was not found on wheat during the winter season but it was not clear whether wheat is a non-host to R. arachidis or whether this nematode were inactive and survived in an anhydrobiotic resting phase or as eggs in the soil and plant rests present from the previous summer growing season. In the summer growing season high R. arachidis numbers were observed in maize root samples, indicating that maize is a definite host to this nematode. The effect of R. arachidis on maize yield.
-
Sudden death syndrome of soybean in South Africa: etiology detection and management
Sudden death syndrome (SDS) of soybean is one of the most important soilborne diseases of soybean and is responsible for economically devastating reductions in yields in North and South America. Several Fusarium species including Fusarium brasiliense, F. crassistipitatum, F. tucumaniae, and F. virguliforme cause the disease in other countries. All these species, as well as F. azukicola, and F. cuneirostrum, were recently included into the newly described Neocosmospora phaseoli. SDS was first reported in South Africa in 2013 in the Lydenburg/Badfontein area, Mpumalanga Province, on a no-till commercial farm planted to soybean cultivar PAN 737 under irrigation for a second consecutive season. The causal organism was initially reported to be F. virguliforme, but later re-identified as F. brasiliense and a novel Fusarium sp. Since then, SDS-causing pathogens were also isolated from samples submitted from fields in the Free State and North West. Although F. brasiliense is currently included in N. phaseoli, the new Fusarium sp. reported in South Africa still needs to be identified. Judging by published information on the disease in other countries, SDS may pose a threat to the South African soybean industry. In order to conduct any epidemiological research and develop management strategies for SDS in South Africa, it is therefore essential to accurately identify the new Fusarium sp., and to determine the distribution and identity of all SDS-causing Neocosmospora spp. (Fusarium spp.) in soybean producing areas in South Africa. The aim of the current study is not only to determine the distribution of the disease and the causal organisms, but also to develop a molecular technique for rapid identification of the SDS-causing pathogen/s and for detection and quantification of these pathogens in soils and plant material and to develop management strategies. The first phase (first two years) of the project include the collection of isolates of Neocosmospora spp. associated with plants displaying SDS symptoms, evaluating pathogenicity and virulence of the isolates and development of molecular tools for rapid detection and quantification of the pathogen in plant material and soil. This summary contains the results of the first year of the first phase of the project. Isolations were conducted from soybean samples submitted by farmers and consultants from Atlanta, Pretoria, Val and Vryheid, from surveys conducted at the national cultivars trials during January 2021 and on farmer's fields (Dannhauser (two farmers), Dundee, Newcastle, Standerton, Ugie and Utrecht) during February and March 2021. Isolates of SDS-causing fungi were obtained from Atlanta, Clarens, Koedoeskop, Dannhauser and Dundee. All isolates from Atlanta and Koedoeskop were molecularly characterized as N. phaseoli and isolates from Clarens, Dannhauser and Dundee are currently being prepared for molecular characterization. The undescribed Fusarium sp. that cause SDS in South Africa was also identified as N. phaseoli. The distribution of SDS in South Africa is therefore extended to include the Gauteng and Limpopo provinces. Isolates of other Neocosmospora spp. closely related to the N. phaseoli were also obtained from many localities. Phylogenetic analysis of the 136 isolates obtained so far identified N. falciformis, N. solani and two putative new species Neocosmospora sp. 1 and Neocosmospora sp. 4. Representatives of these species as well as representative isolates of N. phaseoli identified in South Africa and DNA of type strains of the previously recognised SDS or Bean Root Rot (BRR) causing species F. azukicola, F. crassistipitatum, F. cuneirostrum, F. phaseoli and F. tucumaniae obtained from Kerry O'Donnell (USDA-ARS) were included in the development of the species specific primers. Three gene regions were considered for primer design. Two of the species-specific primer combinations evaluated in this study showed promise for the specific detection of N. phaseoli, but since one of the new species amplify with these primers it will need further optimisation. Species included in the specificity assessments were the closest relatives of N. phaseoli that are expected to occur on soybean in South Africa. The importance of this collection of identified Neocosmospora strains is underlined by the fact that one of the putative new species recovered during this survey was the only non-target species to amplify with the three most specific PCR assays tested. Without prior knowledge or material of this species, further optimisation and possible implementation of these assays as qPCR detection tools for N. phaseoli might have proceeded without additional concerns for specificity, leading to incorrect assessments of the presence and quantity of N. phaseoli DNA in unknown samples. It is important to ensure that the full diversity of this genus is represented in specificity tests of primers and that the developed assay is reliable and accurate. Furthermore, it is extremely difficult to isolate the fungus from samples using conventional methods because of the slow growth of the fungus and diagnosis of SDS in the field can be difficult because several other diseases produce similar symptoms. A molecular detection technique will therefore ensure rapid detection of SDS in samples submitted by farmers. During the second year of the first phase of the project the collection of isolates of N. phaseoli and closely related Neocosmospora species will continue and the primer design and quantification in plant material and soil finalised.
-
Website
Most of this period was dedicated to updating existing and adding new content to the website. On 28 February 2021 the OPDT/OAC's website hosted a total of 447 HTML pages - excluding dynamically created pages - across 14 content sections.
PHP 7.4
The OPDT/OAC's hosting server was upgraded to PHP 7.4** in August 2020. It was a minor version upgrade and the website framework and content were validated to ensure that there would be no errors after the upgrade.
** PHP is the base programming language that is used to output website content to the browser. It is also used to process data stored in the MySQL database in order to create and display the dynamic content in the Crops, Research, Bursaries and News sections.
Soyfood
After taking over ownership of the domains ssa.org.za and soyfood.co.za during 2019/2020, a new section called "Soyfood" was created on the OPDT/OAC's website. Relevant content and documents previously hosted on ssa.org.za have been incorporated into this section.
Visitor statistics Reporting Year Unique Visitors (Raw values *) Unique Visitors (Google values) * Visitors Pages Pages per visit 2007 11 – – – 2008 74 – – – 2009 752 – – – 2010 2 964 – – – 2011 4 037 788 3 284 3.21 2012 4 052 720 3 775 4.25 2013 4 342 674 3 296 3.94 2014 4 503 1 086 4 600 3.62 2015 4 800 1 340 6 993 4.14 2016 4 329 927 5 042 3.83 2017 6 384 909 5 406 4.39 2018 5 428 1 841 8 885 3.59 2019 8 307 1 661 8 340 3.43 2020 14 982 4 805 12 475 2.03 Google values show an increase in page views and a significant increase in unique visitors. Pages per visit increased by a factor of 3. The most page views came from the following pages in order of percentage share:
- Home page, 17.45%
- Soybean Cultivation in South Africa by Wessel van Wyk: 6.36%
- ICB User Info Soybeans 2019/2020: 5.35%
- Soy oilcake price average: 2.91%
- Contact OPDT/OAC: 2.45%
-
Oilseeds information
a. Forums and Trusts
During the 2020/21 financial year the Oilseed Industry held four virtual forum meetings. These meetings were attended by the General Manager, Mr Nico Hawkins and the Head Information, Mr Bernard Schultz. The information of SAGIS was presented to the meetings.All information of SAGIS were made available on the website of SAGIS.
b. SAGIS' Board of Directors during the 2020/21 financial year
Dr Erhard Briedenhann and Mr De Wet Boshoff with Ms Marie van der Merwe as the alternate director represented the Oil and Protein Seeds Development Trust and oilseeds industry on SAGIS' Board of Directors.
Dr John Purchase was elected as the chairperson and Dr Erhard Briedenhann and Ms Mariana Purnell (with equal votes) were elected as Vice Chairperson on the Board of SAGIS.
c. Financial year 2020/21
- Subscription: Main Function (VAT excluded)
A net amount of R15 360 881 was approved by the Members for utilisation during the 2020/21 financial year and the final expenditure amounts to R14 796 740. This included an amount of R173 977 that was foreseen to complete the adjustment on the current computer system to be compatible with new technology and the extension of the warranty on the server for a two year period.
The portion of the Oil and Protein Seeds Development Trust was 15.8% or R2 337 884.94 (VAT excluded). The surplus amount of R89 134.26 was credited against the Oil and Protein Seeds Development Trust's account on the 1 March 2021.
- Audit
The audit of the 2020/21 financial statements was conducted by "The Ashton CA (SA) Group Inc." and an unqualified audit report was issued.
d. General Information
- Co-workers in the Oilseeds Industry
The number of returns per commodity in the oilseeds industry, at 28 February 2021, was as follows:
Commodity February 2021 February 2019 February 2020 Canola 26 21 22 Groundnuts 80 75 75 Soybeans 110 108 106 Sunflower 115 107 109 Total 331 311 312 - Product information
An amount of R83 597.31 (VAT excl.) was approved by the Trust for the Product Information. This was sufficient to cover all expenses for the 2020/21 financial year.
The publication dates are available on SAGIS' website. On 28 February 2021 the actual number of returns from registered co-workers was 84 returns for the oilseed industry.
- Weekly information
An amount of R86 096 (VAT excl.) was approved by the Trust for the Weekly Information. This was sufficient to cover all expenses for the 2020/21 financial year.
The publication dates are available on SAGIS’ website. On 28 February 2021 the actual number of returns from registered co-workers was 35 returns for the oilseed industry.
e. Inspection Department
- Type of mistakes as well as non-compliance to the statutory measures on the whole grain and oilseeds returns per commodity
Mistakes as well as non-compliance to statutory measures March until February Canola Groundnuts Soybeans Sunflower Total 2020 2021 2020 2021 2020 2021 2020 2021 2020 2021 Returns late / outstanding 4 – 32 24 37 31 44 37 117 92 Registration details incorrect – – 1 – – 3 1 – 2 3 Premises of origin incorrect 1 – 7 4 4 6 8 5 20 15 Utilization type incorrect – – 2 1 – 1 – – 2 2 Opening stock quantity incorrect – – – – – – – – – – Receipts quantity incorrect – 1 10 8 4 2 4 4 18 15 Sub class and grades incorrect – – – 2 – – – – – 2 Utilization quantity incorrect – – 9 6 1 4 3 4 13 14 Closing stock quantity incorrect – – 1 3 5 1 – 1 6 5 Stock variance >5% 1 – – 1 3 – – – 4 1 Total 6 1 62 49 54 48 60 51 182 149 - Net effect of mistakes as well as non-compliance to the statutory measures found during audits on (under) / over declarations on SAGIS' publications on:
– Receipt of whole grain and oilseeds
Mass over declared Mass under declared Total mass declared incorrect Total received audited Mass declared incorrect as % of total received Net effect of (under) / over declared Ton Ton Ton Ton % Ton a b c d e f g h e : g f : h a - c b - d 2020 2021 2020 2021 2020 2021 2020 2021 2020 2021 2020 2021 Canola – – – – – – 132 834 91 051 – – – – Groundnuts 1 396 472 2 740 850 4 136 1 322 43 578 69 275 9.5 1.9 (1 344) (378) Soybeans 167 20 256 50 423 70 1 335 846 1 219 887 – – (89) (30) Sunflower 69 9 72 17 141 26 461 448 784 864 – – (3) (8) – Utilization of whole grain and oilseeds
Mass over declared Mass under declared Total mass declared incorrect Total utlized audited Mass declared incorrect as % of total received Net effect of (under) / over declared Ton Ton Ton Ton % Ton a b c d e f g h e : g f : h a - c b - d 2020 2021 2020 2021 2020 2021 2020 2021 2020 2021 2020 2021 Canola – – – – – – 103 988 66 453 – – – – Groundnuts 446 66 369 448 815 514 50 543 59 023 1.6 0.9 77 (382) Soybeans – 539 411 533 411 1 072 1 062 565 1 010 615 – 0.1 (411) 6 Sunflower 66 3 097 69 3 327 135 6 424 438 257 559 622 – 1.1 (3) (230) – Whole grain and oilseeds stocktaking
Commodity Physical stock-taking ¹ Adjusted stock counted (t) Stock declared on returns (t) Net effect of under / (over) declared (t) Difference between stock counted and declared on returns a b c d a - c b - d Under (t) Over (t) Under (%) Over (%) 2020 2021 2020 2021 2020 2021 2020 2021 2020 2021 2020 2021 2020 2021 2020 2021 Canola 29 512 6 37 232 6 35 255 6 1 977 – 1 977 – – – 5.61 – – – Groundnuts 8 373 11 169 8 670 12 334 8 646 12 255 24 79 24 79 – – 0.28 0.64 – – Soybeans 543 096 259 813 558 054 268 384 564 295 271 882 (6 241) (3 498) – – 6 241 3 498 – – 1.11 1.29 Sunflower 71 664 256 264 70 407 268 457 70 791 263 691 (384) 4 766 – 4 766 384 – – 1.81 0.54 – Total 652 645 527 252 674 363 549 181 678 987 547 834 (4 624) 1 347 2 001 4 845 6 625 3 498 0.29 0.88 0.98 0.64 Note: For comparison purposes, the physical stock was adjusted to compare it with the stock declared on the return as per month-end.
- Oilseeds products
Mass over declared Mass under declared Total mass declared incorrect Total produced audited ¹ Mass declared incorrect as % of total received Net effect of (under) / over declared Ton Ton Ton Ton % Ton a b c d a + c = e b + d = f g h e : g f : h a - c b - d 2020 2021 2020 2021 2020 2021 2020 2021 2020 2021 2020 2021 Coconut Oil – – – – – – – 413 – – – – Palm Oil and derivatives – – 79 107 – 79 107 – 95 924 323 252 82.5 – (79 107) – Soybean Oil – – 5 087 – 5 087 – 92 549 166 660 5.5 – (5 087) – Groundnut Oil – – – 40 – 40 – 24 318 – 0.2 – (40) Sunflower Oil – – 49 482 – 49 482 – 178 891 163 161 27.7 – (49 482) – Rapeseed / Canola Oil – 33 – – – 33 9 081 9 604 – 0.3 – 33 Cottonseed Oil – – – – – – – 1 830 – – – – Corn (maize) Oil – – – – – – 2 469 1 555 – – – – Other Oil (blends or mixes not included in the above oil) – – – – – – 444 6 – – – – Cottonseed Oilcake – – – – – – – 594 – – – – Sunflower Seed Oilcake – – 4 – 4 – 228 925 116 336 – – (4) – Coconut Oilcake – – – – – – – 890 – – – – Palmnut Oilcake – – 4 800 – 4 800 – 12 000 – 40.0 – (4 800) – Soybean Oilcake 2 906 – 393 70 3 299 70 565 500 678 171 0.6 – 2 513 (70) Rapeseed / Canola Oilcake – – – – – – 12 702 9 064 – – – – Biodiesel – – – – – – – – – – – – Soybean flours and meals – – 54 – 54 – 22 365 20 986 0.2 – (10) – Soybean full-fat 85 318 442 181 527 499 122 847 72 553 0.4 0.7 (357) 137 Peanut Butter and paste – – 10 – 10 – 5 334 4 280 0.2 – (10) – Textured Vegetable Protein – – – – – – 2 921 8 548 – – – – Note: The production refers to the number of tons audited and not to RSA total production.
f. Conclusion
SAGIS appreciates the support and co-operation of all the role-players.
We wish to express our gratitude especially towards the Members of the Oil and Protein Seeds Development Trust for their continued support, financially and otherwise.
- Subscription: Main Function (VAT excluded)
-
Cultivar evaluation of oil and protein seeds in the winter rainfall area: Western and Southern Cape (canola)
Introduction
During 2020, the number of trials in the Swartland and Southern Cape was limited to 2 and 3 localities respectively. Two planting date trials were planted at Langgewens and Tygerhoek, as well as an elite trial at both localities. In the 2020 season, a total of 14 cultivars were tested in the cultivar evaluation program. It consisted out of four conventional, four Cl (Clearfield, Imasamoks tolerant) and five from the TT group (Triazine tolerant). For the 2nd year, a combination type cultivar was included in the trials that is both Cl- and TT tolerance (Hyola 580CT). There were no new cultivars tested, due to the challenges in 2020.
Climate
This past season in the Swartland was characterized by below average rainfall, although the rainfall was close to normal during July. This rainfall in 2019, expressed as a percentage (%) of the long term, ranged between 53% and 86%. Langgewens received 199mm in 2019 compared to a 12 year average of 306mm for the period 1 May to the end of October. Throughout the region, there was very low monthly rainfall in August and September with very hot temThe in season rainfall at Langgewens in the Swartland was 12mm less than the long-term average, while the rainfall during June, July and August was better than the long-term average. The temperatures and especially the maximum temperature were above average for the period. Canola plants are very sensitive to high temperatures during the period from flowering to the end of seed filling. During the period, the maximum (1.1°C) and minimum temperatures (1.4°C) were lower than the long- term average. Cooler temperatures also occurred during September.
Tygerhoek in the Southern Cape had a drier autumn than the long-term average indicates. However, the average rainfall for the growing season was 92mm more than the long-term growing season averaging of 244mm. The average temperatures during August was 1.6°C (maximum temperature) and 1.4°C (minimum temperature) lower than the long-term average. The minimum temperature during September at Tygerhoek was lower than at Langgewens. Both the maximum and minimum temperatures were also lower during October, consequently had the canola in the Overberg favourable temperatures during the seed filling period.
Results
The Swartland trials have been exposed to average moisture conditions with lower than normal temperatures during the flowering and seed filling period. In the Swartland, the average yield per trial ranged from 3324kg ha-1 (Langgewens 1st planting) to 2269kg ha-1 at Hopefield.
The Cl cultivars 44Y90 (4072 kg ha-1) and 43Y92 (3570 kg ha-1) were cultivars with the highest yield at Langgewens, 1st sowing and 2nd sowing respectively. Diamond (3367kg ha-1) and Quartz (3318kg ha-1) were the two conventional cultivars that gave on average the highest yield in the Swartland. The TT cultivar Alpha (2863kg ha-1) had the highest average yield in the Swartland followed by Hyola 559TT (2776kg ha-1).
In the Rûens the trial averages varied between 4045 kg ha-1 on Riversdal and 3015 kg ha-1 on Tygerhoek 1st sowing date. The yield of the first sowing date was negatively affected by uneven germination. The average yield however, was 3704 kg ha-1 compared to 1678 kg ha-1 in 2019.
Due to the long growing season, the Cl cultivar with the longer growing season gave the highest yield in the trials. The average yield of 45Y93 was 4549 kg ha-1. The cultivar with the second highest yield in 2020 was the Cl cultivar, 44Y90.
The conventional cultivar Quartz (4072 kg ha-1) produced the highest average yield in the conventional group, as in 2019. They were followed by the conventional cultivar Diamond (3824 kg ha-1). In the TT group, Alpha TT (3659 kg ha-1) produced the highest yield followed by Hyola 650TT (3552 kg ha-1) with the combination cultivar Hyola 580CT (3373 kg ha-1) in 3rd place.
Conclusion
The impact of the climate in the 2020 season was very good on seed production. The result of a cool August and September was that the growing season was longer than normal. The yield on corresponding localities was 67% and 133% higher in the Swartland and Southern Cape respectively. The 2019 and 2020 seasons highlight the tremendous negative impact that climate change can have on production in the Western Cape.